Using Dot :: II
Posted by Subash | 7:02 PM
[0] Comments
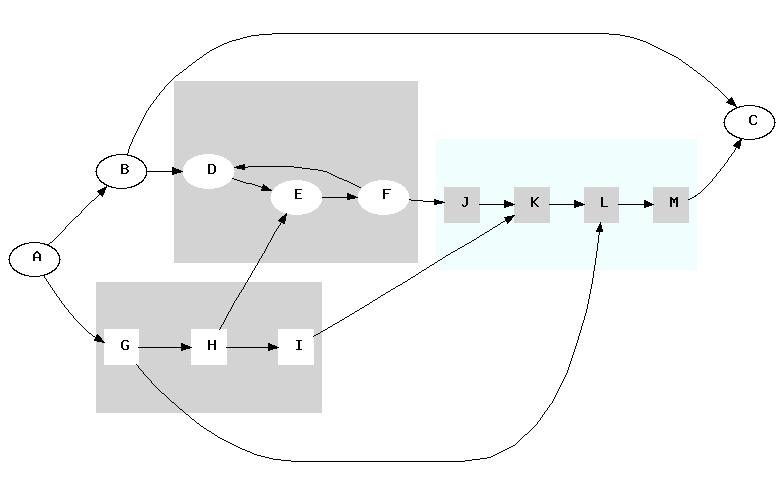
Not only Dot can be ued for Graph Visualization but it can also be used for creating presentation quality diagrams as well. Here is a simple example of creating presentation quality diagrams using dot. It is generated completely from text by describing the graph in Dot language. Here is the source code of it:-
digraph xxs {
  rankdir="LR";
  size="8,5";
  ratio="fill";

  A -> B;
  B -> C;

subgraph cluster0 {
    node [style=filled, color=white];
    style=filled;
    color=lightgrey;
    D -> E -> F;
    F -> D;
  }

subgraph cluster1 {
    node [style=filled];
    color=blue;
    G -> H -> I;
  }

  subgraph cluster2 {
    rankdir="TB";
    rotate="90";
    node [style=filled, color=lightgrey, shape=Msquare];
    style=filled;
    color=lightblue;
    J -> K -> L -> M;
  }

  I -> K;
  G -> L;
  M -> C;
  A -> G;
  B -> D;
  H -> E;
  F -> J;
}
